
Tracing#
Tracing provide a panoramic view of what happens when an application makes a request. A trace can be considered as a Directed Acyclic Graph (DAG) composed of multiple Spans. openYuanrong’s Traces feature is implemented based on Opentelemetry.
Basic Concepts#
A Span can be understood as a method call, a program block invocation, or an RPC/database access. Any program access with a complete time cycle can be considered as a Span.
Span Tag: A collection of Span tags consisting of key-value pairs. In key-value pairs, keys must be strings, and values can be strings, booleans, or numbers.
Span Log: A collection of Span logs. Each log operation contains a key-value pair and a timestamp. In key-value pairs, keys must be strings, and values can be any type. However, note that not all OpenTracing-compatible Tracers need to support all value types.
SpanContext: Span context object.
Any OpenTracing implementation needs to transmit the current call chain state (such as trace and span IDs) across process boundaries, relying on a unique Span.
Baggage Items: Trace accompanying data, a key-value pair collection that exists in the trace and also needs to be transmitted across process boundaries.
References (Span Relationships): Zero or more related Spans (Spans establish this relationship through SpanContext).
The timeline relationship between Traces and Spans is as follows:
––|–––––––|–––––––|–––––––|–––––––|–––––––|–––––––|–––––––|–> time
[Span A···················································]
[Span B··············································]
[Span D··········································]
[Span C········································]
[Span E·······]
[Span F··]
[Span G··]
[Span H··]
Enabling Trace#
To enable Trace, you need to configure the following parameters when deploying openYuanrong:
enable_trace: Trace switch.runtime_trace_config: Trace data exporter configuration, currently supports OtlpGrpcExporter and LogfileExporter exporters.
OtlpGrpcExporter Exporter#
The OtlpGrpcExporter exporter exports data using gRPC protocol and protobuf serialization format according to OTLP specification. To use OtlpGrpcExporter for data export, it is recommended to deploy a data reception and processing backend in advance (otel-collector\jaeger\grafana, etc.). For grafana deployment, refer to Opentelemetry official examples.
The initialization parameters for OtlpGrpcExporter exporter are as follows:
Initialization Parameter |
Description |
Constraint |
|---|---|---|
enable |
Whether to enable OtlpGrpcExporter exporter |
Required |
endpoint |
Receiving backend address, format is ip:port |
Required |
LogfileExporter Exporter#
The LogfileExporter exporter exports data to log files. Its initialization parameters are as follows:
Initialization Parameter |
Description |
Constraint |
|---|---|---|
enable |
Whether to enable LogfileExporter exporter |
Required |
Configuration Examples#
Enabling Trace on Host Cluster#
Configuration reference command is as follows:
yr start --master --enable_trace true --runtime_trace_config "{\"otlpGrpcExporter\":{\"enable\":true,\"endpoint\":\"192.168.1.2:4317\"},\"logFileExporter\":{\"enable\":true}}"
This example enables both OtlpGrpcExporter and LogFileExporter exporters. Trace data will be exported to the backend service at address 192.168.1.2:4317 and log files.
Enabling Trace on K8s Cluster#
Modify the values.yaml configuration file in the helm package.
observer:
  trace:
    enable: true
    runtimeTraceConfig: "{\"otlpGrpcExporter\":{\"enable\":false,\"endpoint\":\"192.168.1.2:4317\"},\"logFileExporter\":{\"enable\":true}}"
This example enables LogFileExporter exporter. Trace data will be exported to log files.
Viewing Trace Data#
Viewing Data from OtlpGrpcExporter Exporter#
Taking Trace data exported to grafana backend as an example.
Log in to the grafana backend. Address is: machine IP:3000.
Click the Explore tab on the left sidebar.
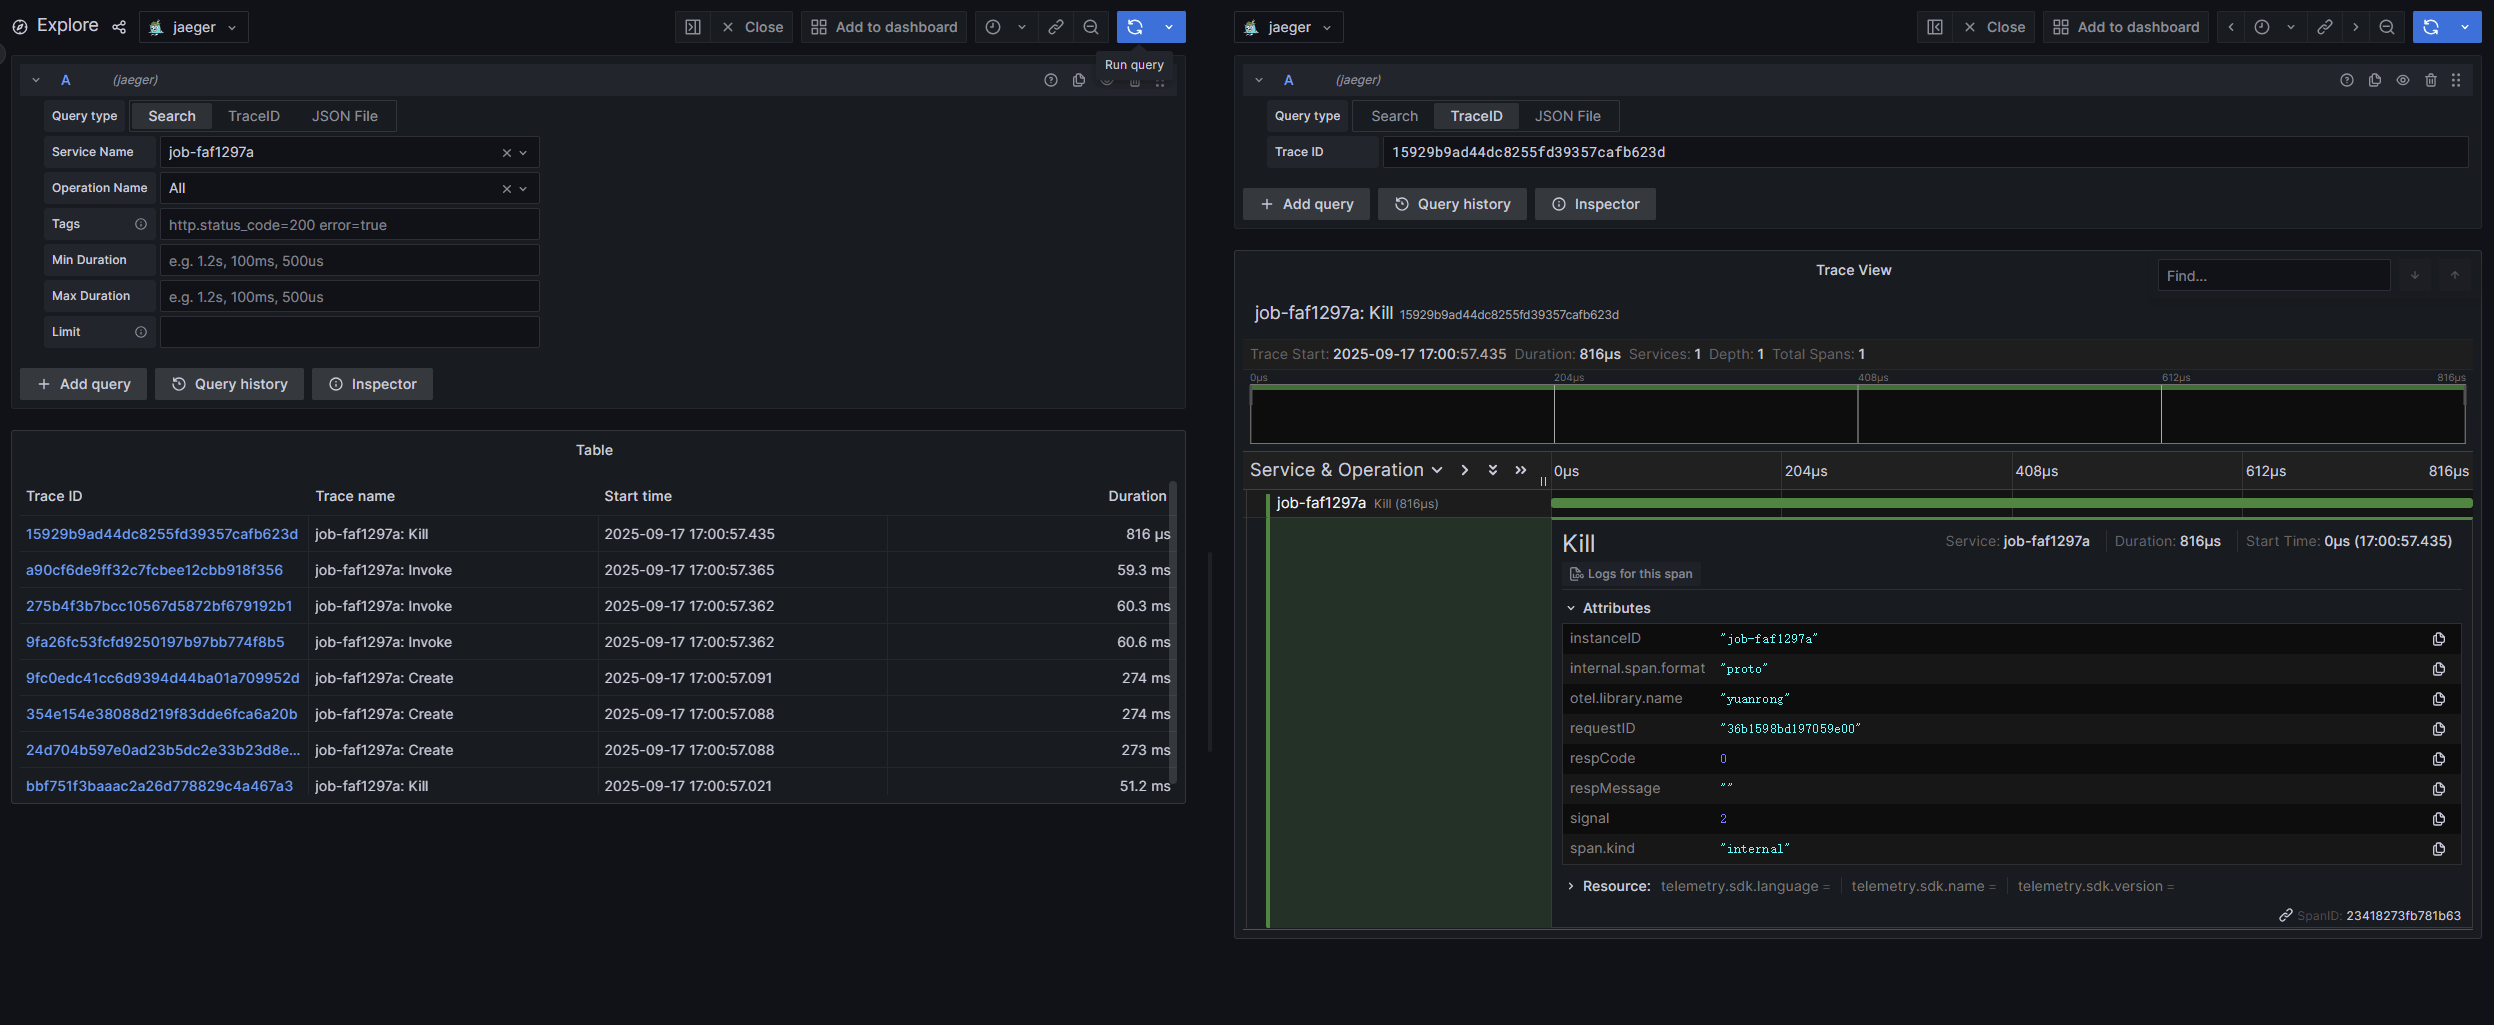
Select the target function instance from the Service Name dropdown box, and click the Run query button in the upper right corner to query Trace data related to the function instance.
Viewing Data from LogfileExporter Exporter#
Deployment Method |
Log Path |
|---|---|
Host Deployment |
1. job-xxx-driver.log file |
K8s Deployment |
1. job-xxx-driver.log file |
Search for the keyword trace info in log files to find exported trace data.
Note
Set the following environment variables in advance for exported trace data to appear in the job-xxx-driver.log file.
export ENABLE_TRACE=true
export RUNTIME_TRACE_CONFIG="{\"otlpGrpcExporter\":{\"enable\":true,\"endpoint\":\"192.168.1.2:4317\"},\"logFileExporter\":{\"enable\":true}}"
Trace Data Example#
Taking OtlpGrpcExporter exporter configured to connect to grafana as an example, no additional code is needed. openYuanrong will export key process call chains. Execute the following stateless function.
import yr
yr.init()


@yr.invoke
def add(n):
    return n+1


results = [add.invoke(i) for i in range(3)]
print([yr.get(i) for i in results])

yr.finalize()
Trace data reported to grafana is shown in the figure below: